
Have you seen the enormous volume of publicly available data, as well as written analyses, tables and maps? Whatever stats make your skirt fly up, you’ll find them at the US Census Data website.
2020 Census Data is still coming in. You can signup to receive updates as new information becomes available
You may find some interesting bits of info to share with your client or maps to to add depth to your next pitch or proposal. I could go down the Census Data rabbit hole for days, literally. In addition to raw data, they provide analysis tools as well as written analyses on a ton of topics. Quick Facts, cross-tabs, and even infographic maps can be conjured up with a few clicks.
Play time with Population Pyramids

Megalopolis. Seriously.
Have you heard of Megalopolis? Thanks to this jaw dropping visual, it’s easy to see why this population dense region was so named. It’s also fun to say. Megalopolis.
Jean Gottmann penned the term in his 1961 study about urban trends. He determined Megalopolis to be a region within the northeastern United States that extends from northern Virginia to southern New Hampshire. The area includes popular cities like Washington, Baltimore, Philadelphia, New York, and Boston.
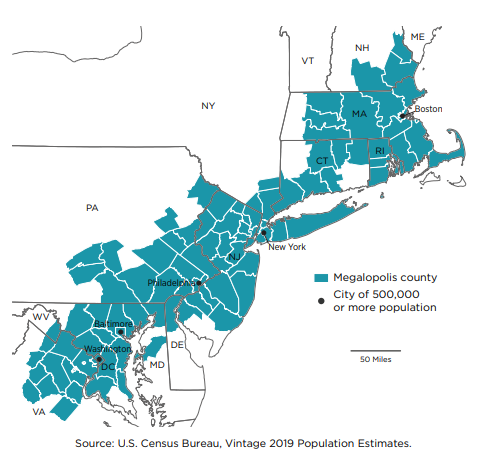
Today, approximately 50 million people live in this band of 103 counties, representing about 15% of all Americans.
Oh-so-much more available to you at the US Census Bureau website.
Leave a Reply